
In many SQL Server environments, performance troubleshooting starts with pressure, not with clarity. Users are waiting, jobs are delayed, reports take longer than usual, and application teams need an answer before anyone has properly framed the problem. At that point, the natural reaction is to look for the most visible signal first. CPU is high, a wait type dominates the monitoring view, a query looks expensive, or a blocking session is clearly visible.
That reaction is understandable. It is also one of the reasons why SQL Server troubleshooting can go in the wrong direction before the real analysis has even started.
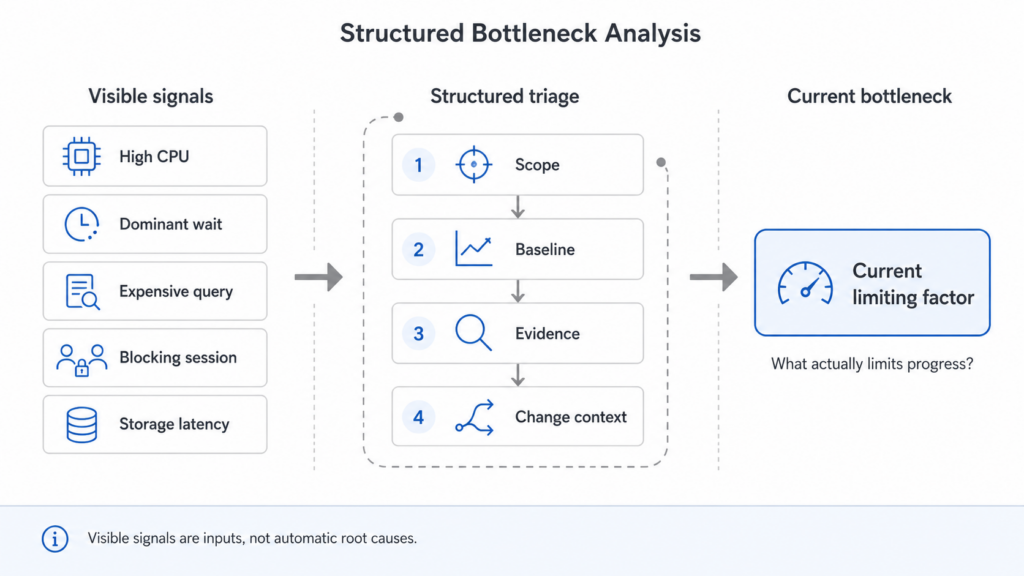
The problem is not the signal itself. Wait statistics, execution plans, Query Store data, blocking chains, performance counters, storage metrics, and application timelines can all provide valuable evidence. The risk starts when the first visible signal becomes the assumed root cause too early. From that moment on, the investigation often turns into a search for confirmation instead of a structured analysis.
The visible signal is not always the bottleneck
A bottleneck is not simply the metric that looks worst on a dashboard. It is the current constraint that limits useful progress for a specific workload at a specific point in time. That distinction matters more than it may seem.
A high CPU graph can point to real CPU pressure, but it can also reflect inefficient queries, changed execution plans, higher concurrency, missing indexes, parameter sensitivity, or a workload pattern that has shifted over time. A dominant wait type can be important, but wait statistics need context: which workload produced them, during which time window, under which load, and compared to which baseline? A blocking chain can explain user-facing delays, but the important question is often not only which session is blocking. It is why a transaction is holding locks longer than expected, whether this behavior is new or recurring, and whether it belongs to the application design rather than the database engine alone.
In practice, the most visible signal is often only the first door into the problem. It may lead to the bottleneck, but it should not be treated as the answer before the surrounding evidence has been checked.
Why guesswork becomes expensive in production
Guesswork in SQL Server troubleshooting does not always look careless. Quite often, it looks professional from the outside. Someone checks a dashboard, opens an execution plan, reviews wait statistics, identifies a suspicious query, and applies a change that seems reasonable. The process uses real tools and real data, but without a clear sequence those tools can still lead the investigation toward the wrong conclusion.
When the scope is unclear, every metric can appear relevant. Without a baseline, words like “high”, “slow”, and “unusual” become subjective. The wrong time window can make the data describe a different problem than the one users experienced. Once the investigation focuses too early on one component, other explanations disappear from view.
This is where quick fixes become risky. A new index might reduce one query cost but increase write overhead or maintenance complexity. A configuration change might improve one workload while creating pressure somewhere else. Killing a blocking session might release users for a moment but hide the transaction pattern that needs to be understood. Restarting a service may remove the symptom temporarily while destroying the evidence needed to explain what happened.
In real production environments, the expensive part is not only the outage or slowdown itself. It is the point where several well-intentioned changes make it harder to understand what originally happened.
Good bottleneck analysis starts with problem definition
Structured bottleneck analysis does not mean delaying action unnecessarily. It means making the first actions more useful.
Before going deep into execution plans, indexes, waits, or storage metrics, the problem needs a clear frame. What is actually affected? Is it one query, one stored procedure, one application function, one database, one SQL Server instance, or a broader platform issue? When did the behavior start? Does the issue appear constantly, only under load, or at specific times? Does it correlate with a deployment, maintenance job, reporting workload, data growth, batch process, backup activity, or changed user behavior?
This first step often feels basic, but it is where many investigations become either focused or noisy. Without a clear scope, the analysis can easily expand in every direction. The team looks at CPU, memory, I/O, waits, plans, indexes, jobs, application logs, and network latency at the same time, but without a clear order. That may create activity, but not necessarily progress.
A useful problem definition does not need to be perfect. It needs to be explicit enough to guide the next step. For example: “The order search procedure is slower than usual during business hours since yesterday’s deployment” is a much better starting point than “SQL Server is slow”. It gives the analysis a workload, a time window, a comparison point, and a potential change context.
Triage is about reducing uncertainty in the right order
In SQL Server troubleshooting, triage should reduce uncertainty step by step. It is not about proving the first plausible theory. It is about deciding which question needs to be answered next.
A practical triage sequence often starts with scope. What is affected, and what is not affected? A single slow application function leads to a different investigation than an entire instance under pressure. Write-heavy procedures may shift the focus toward concurrency, locking, logging, and storage behavior. A reporting workload that becomes slower after data growth may require a closer look at plan quality, memory grants, tempdb usage, or indexing strategy.
Baseline and evidence give the analysis direction
The next step is baseline. Compared to what is the system slow? A query that takes 30 seconds may represent a severe incident if it usually finishes in two seconds. The same runtime may be normal if the query processes a larger data set once per month. CPU at 80 percent may be acceptable for one system and unusual for another. Without baseline, performance analysis becomes too dependent on personal perception.
Evidence comes after that. Wait statistics, execution plans, Query Store, DMVs such as sys.dm_os_wait_stats, monitoring data, job history, storage metrics, and application logs all have value, but they need to answer a specific question. Data collection without a question often produces more noise. The goal is not to collect every possible metric. It is to collect enough relevant evidence to confirm or reject the next assumption.
Only then does it make sense to move toward change. In a stable troubleshooting process, changes stay targeted, limited, and documented. A clear hypothesis should guide each change, and validation should follow it. Otherwise, it becomes difficult to know whether the system improved because of the change, despite the change, or because the workload simply moved on.
Experience helps, but it needs discipline
In real troubleshooting work, experience matters a lot. After you have seen enough production systems, certain patterns become familiar: blocking that does not look accidental, waits that suggest a workload shift, execution plans that point to parameter sensitivity, maintenance activity that competes with business workload, or index designs that made sense years ago but no longer fit the current system.
That experience is valuable. It can also become a trap when pattern recognition turns into confirmation bias.
The first plausible explanation is not always wrong. Sometimes it is exactly right. Problems start when the team accepts that explanation too early. A structured approach protects the analysis from becoming too dependent on habit, pressure, or the loudest metric in the room.
This is especially important in mature SQL Server environments. Many systems are not slow because of one isolated bad setting. They become difficult to troubleshoot because workload, data volume, application behavior, indexing choices, maintenance routines, high availability requirements, and years of operational decisions interact in ways that are not visible from one metric alone.
In those environments, technical skill is necessary, but it needs a clear order to be useful.
Keeping bottleneck analysis useful in production
A useful troubleshooting approach does not need to be complicated, but it does need enough discipline to keep the investigation from spreading in every direction. The symptom should be described in both business and technical terms: which users, jobs, reports, or application functions are affected, and what does “slow” mean in this specific case?
The time window matters just as much. Many wrong conclusions come from analyzing data outside the period in which users actually experienced the problem. A slow report at 09:15 should not automatically be explained by instance-wide wait statistics collected across the whole day, and a query plan captured after mitigation may not represent the plan that caused the incident.
From there, the analysis should compare current behavior against a meaningful baseline. The important question is not only whether a number looks high. It is whether it is unusual for this system, this workload, this time window, and this data volume. Only then can signals such as CPU usage, blocking, memory pressure, expensive plans, or storage latency be interpreted with enough context.
When the evidence supports a change, that change should be small enough to validate and clear enough to explain afterwards. In production, being able to describe what was changed, why it was changed, and which result was expected is not an administrative detail. It is part of responsible troubleshooting.
Structure is not the opposite of speed
One common objection to structured troubleshooting is that production pressure does not leave time for methodology. In reality, the opposite is often true. Structure is what prevents time from being lost in the wrong direction.
A disciplined triage process does not mean waiting passively while users suffer. It means choosing the next action based on scope, baseline, evidence, and risk. That next action may be a temporary mitigation, a deeper analysis step, or a pause before a risky change until the evidence becomes clearer.
The important point is that action and analysis should not be separated from each other. Good troubleshooting connects them. It asks: What do we know? What do we assume? What can we verify? What is safe to change? What would prove that this change helped?
That mindset is often the difference between a temporary workaround and a real understanding of the problem.
Conclusion
SQL Server bottleneck analysis needs structure because production systems rarely fail in a clean, isolated way. The visible symptom may be important, but it is not automatically the root cause. A wait type, a slow query, a blocking session, or a busy CPU graph can all point in the right direction, but only when they are interpreted in context.
Good troubleshooting starts before the deepest technical analysis. It starts with a clear problem definition, a relevant time window, a baseline, and the discipline to separate signals from causes.
In my experience, this does not slow down serious troubleshooting. It makes it more reliable. In practice, the most useful troubleshooting work is rarely the fastest guess. It is the analysis that shows which constraint currently matters, why it matters, and whether a change is likely to improve the system rather than just move the problem elsewhere.
