
Bjoern@CraftedSQL
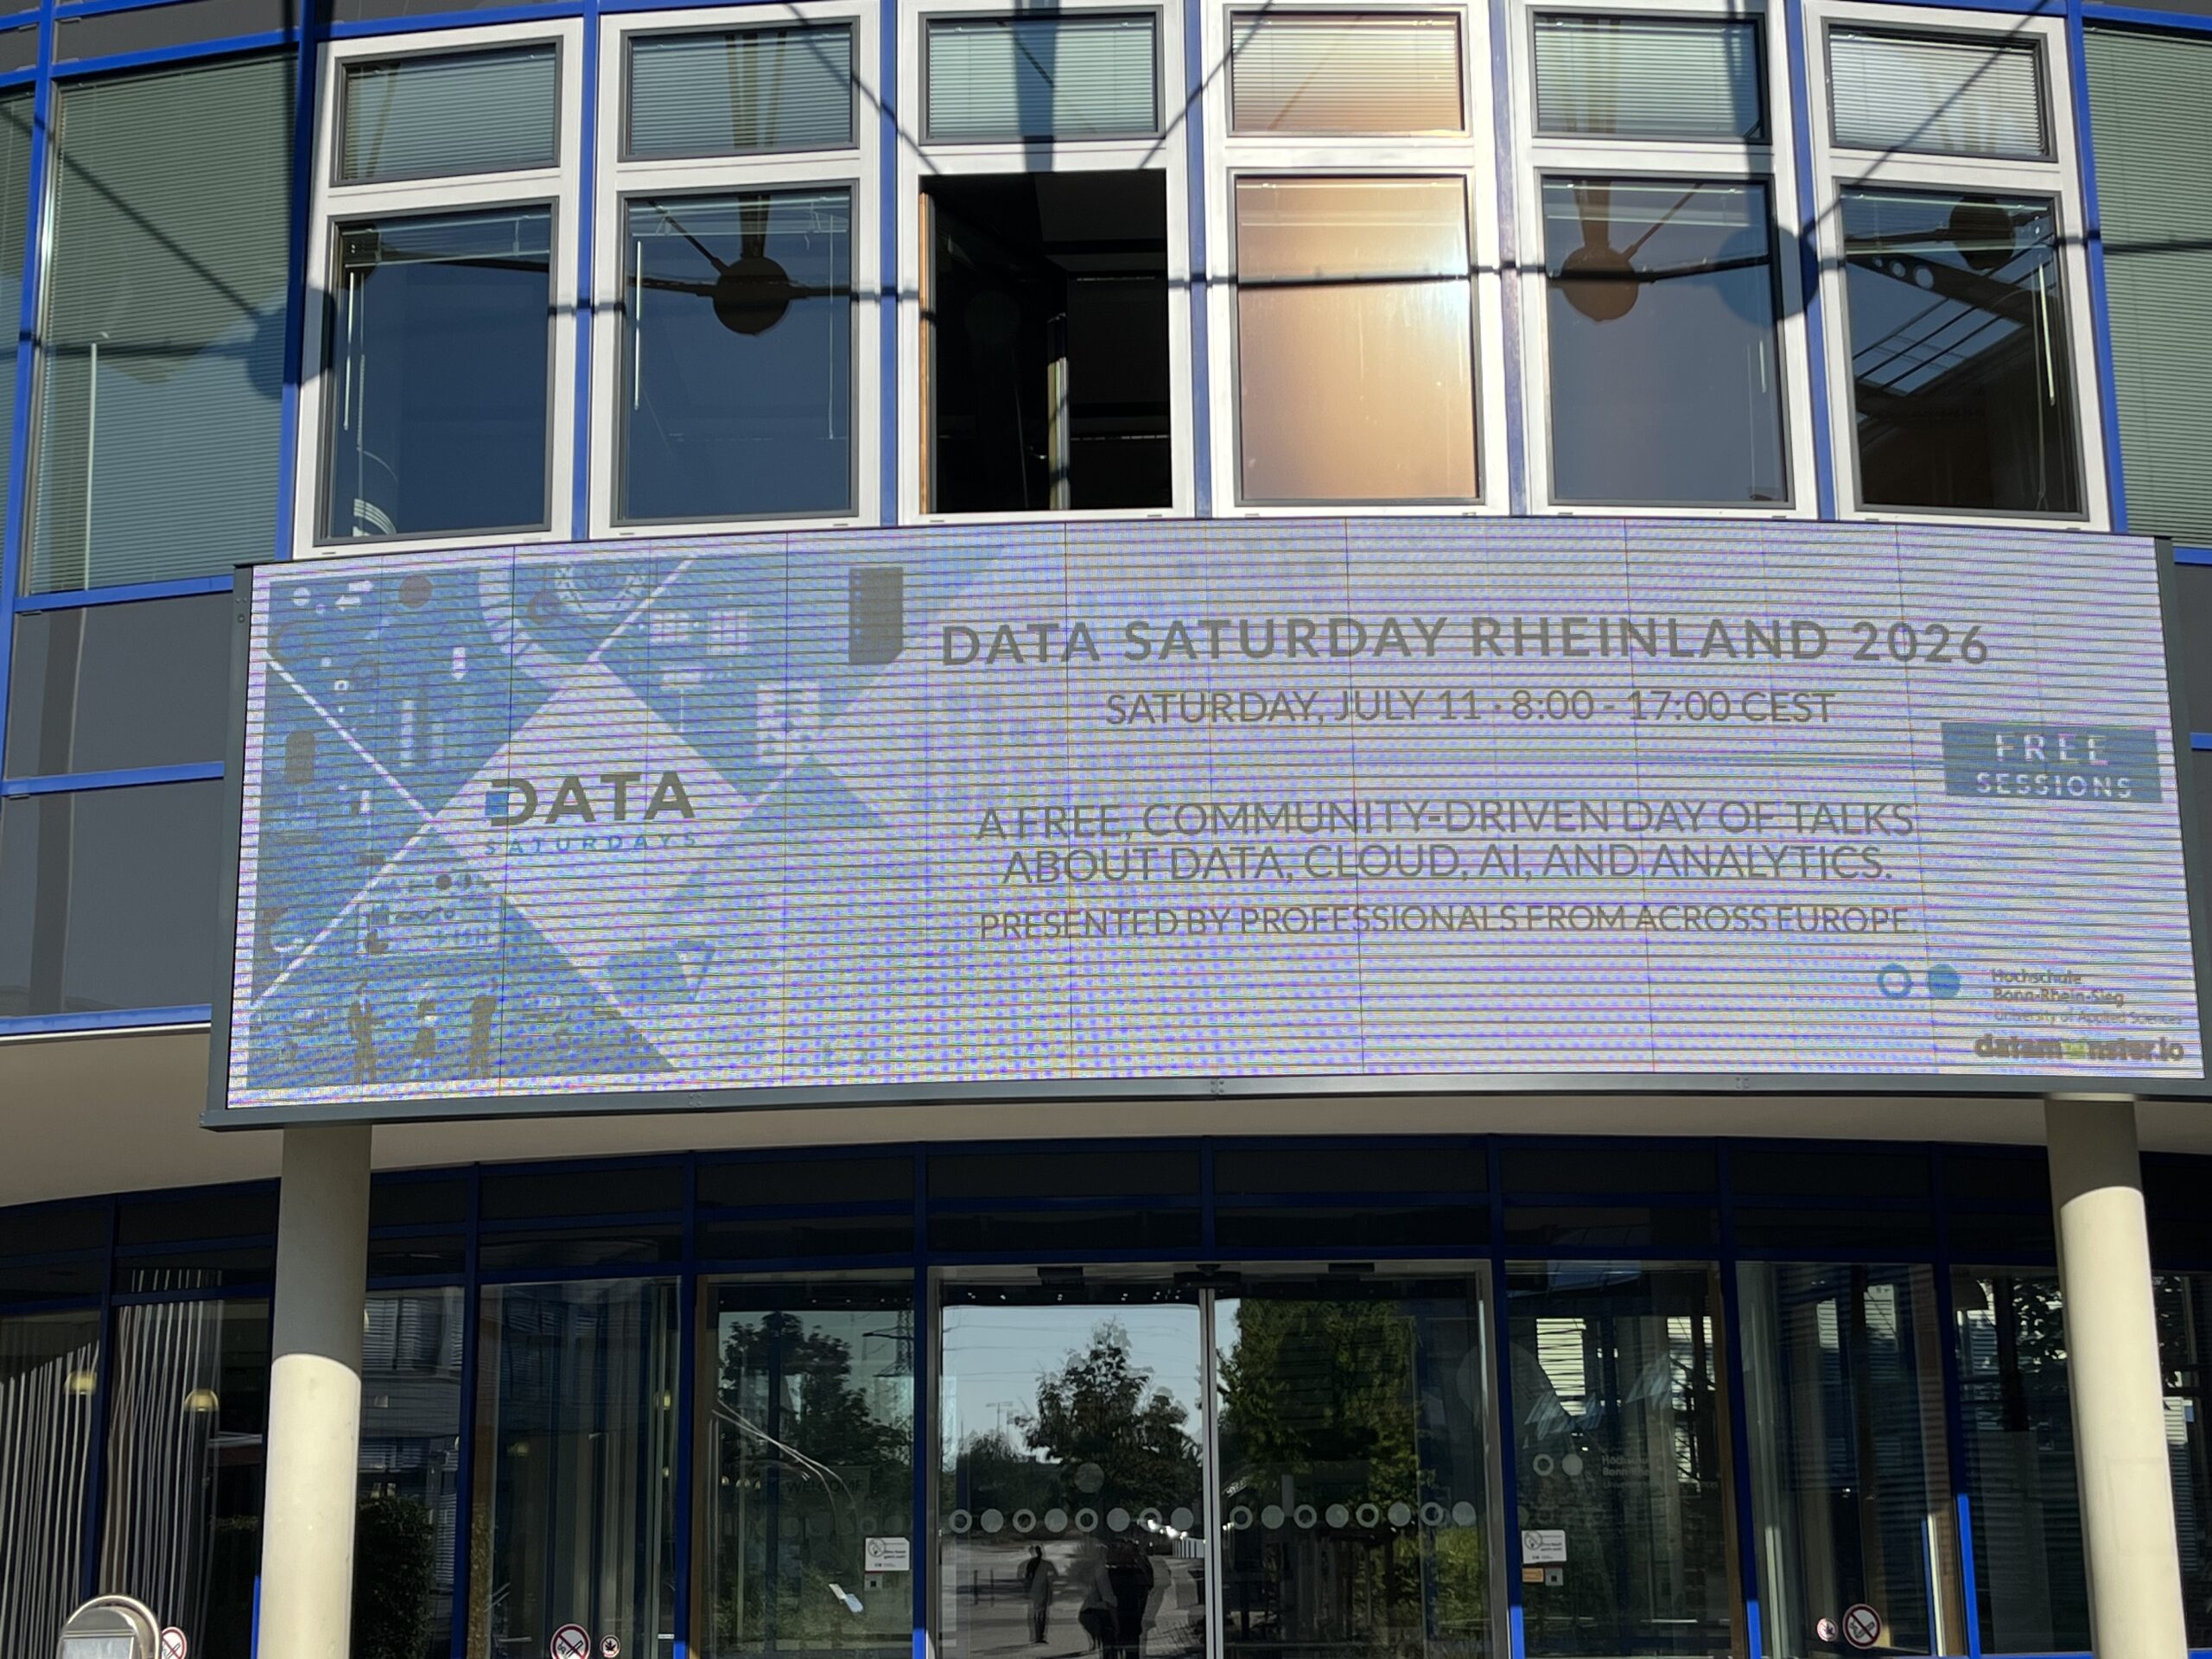
What I Took Away from Data Saturday Rheinland 2026
Two days of technical sessions, direct conversations with speakers and practical exchange with other data professionals at Data Saturday Rheinland 2026.

SQL Server Wait Statistics Are Not a Diagnosis
SQL Server wait statistics are often one of the first things people check when performance drops, and for good reason. They show where SQL Server is spending time and can provide a useful direction at the start of an investigation. The problem begins when the highest wait type becomes the ...
AWS Summit Japan 2026: Agentic AI, Data Platforms, and the Operational Reality Behind the Hype
At AWS Summit Japan 2026, the AI message was hard to miss. But the more interesting signal was not the headline itself. It was how naturally Agentic AI data platforms are now being discussed together with infrastructure, analytics, security, developer experience, and operations. This matters because AI does not run ...
SQL Server Monitoring Is Not Diagnosis: Why Context Matters
Many companies already have dashboards, alerts and monitoring data. In that sense, the problem in SQL Server operations is often not a complete lack of visibility. CPU usage is measured, storage latency is reported, blocking is detected, long-running queries appear in reports, Query Store records plan changes, and availability-related components ...
SQL Server Monitoring: Why Alerts Alone Do Not Create Stability
Most companies no longer have a simple visibility problem. Visibility is only the first step At least not in the way they might have had ten or fifteen years ago, when teams often ran critical systems with very little historical data, few useful alerts and limited insight into what had ...
SQL Server Bottleneck Triage: How to Separate Signals from Causes
In many SQL Server performance investigations, the first visible bottleneck becomes the main suspect almost immediately. CPU is high, storage latency appears in the monitoring tool, blocking shows up in a session overview, or users report that one part of the application suddenly feels slow. Under production pressure, that first ...
SQL Server Bottleneck Triage: How to Separate Signals from Causes
I have seen many SQL Server bottlenecks investigated through the metric that looked loudest, not through the question that mattered most. CPU is high, storage latency looks suspicious, blocking appears in monitoring, or users report that the application feels slow. At that moment, it is tempting to follow the most ...
Using AI in SQL Server Work Without Handing Over Responsibility
In many SQL Server environments, the difficult part is not collecting technical information. There are waits, execution plans, error logs, configuration values, SQL Server performance monitoring and tuning tools, backup history, job runtimes, and usually more than one opinion about what the real problem might be. The challenge is to ...
SQL Server Bottleneck Triage: How to Separate Signals from Causes
In SQL Server performance work, the first minutes of an incident often set the direction for everything that follows. CPU is high, storage latency looks uncomfortable, blocking appears in monitoring, or the application reports timeouts. These signals matter, and they often provide the right starting point. Problems begin when teams ...
SQL Server Troubleshooting: Why Bottleneck Analysis Needs Structure Before Action
In many SQL Server environments, performance troubleshooting starts with pressure, not with clarity. Users are waiting, jobs are delayed, reports take longer than usual, and application teams need an answer before anyone has properly framed the problem. At that point, the natural reaction is to look for the most visible ...