
In many SQL Server performance investigations, the first visible bottleneck becomes the main suspect almost immediately. CPU is high, storage latency appears in the monitoring tool, blocking shows up in a session overview, or users report that one part of the application suddenly feels slow. Under production pressure, that first signal is tempting. It gives the room something concrete to talk about, and it often gives the investigation a useful starting point for SQL Server bottleneck triage.
The problem begins when that starting point quietly turns into the conclusion. In real SQL Server environments, CPU, I/O, blocking, memory pressure, network latency, client behavior and application design rarely exist as isolated topics. They interact with workload timing, execution plans, transaction scope, configuration, data volume, concurrency and the operational history of the system. A visible bottleneck may be part of the truth, but it is not automatically the cause of the problem the business is experiencing.
This is why SQL Server bottleneck triage is not about finding the loudest metric. It is about separating visible symptoms from defensible causes.
The loudest signal is not always the root cause
When a production system slows down, someone usually wants a quick category. Is it CPU? Storage? Blocking? Network? The database engine? The application? These categories are useful because they reduce the initial uncertainty. They give different teams a shared language and help prevent the investigation from jumping between unrelated assumptions.
But a category is not a conclusion. A high CPU graph may point to expensive query execution, but it may also be the result of inefficient plans caused by stale statistics, parameter sensitivity, missing indexes, excessive parallelism, or a workload pattern that changed earlier in the day. Elevated I/O latency may indicate a storage problem, but it may also be driven by queries reading far more data than expected, by maintenance jobs running at the wrong time, or by memory pressure forcing more physical reads than usual.
Blocking follows the same pattern. It is visible, measurable and often painful for users, but it is not automatically the root cause. Blocking may be caused by long transactions, missing indexes, inefficient access paths, poorly timed reports, isolation level choices, application retry behavior, or workloads meeting each other in a way the system was never designed to handle. Calling it a blocking problem may be technically correct, but still operationally incomplete.
In practice, the first useful question is not simply “which bottleneck category do we have?” A better question is: what evidence do we have that this signal explains the user impact, the workload behavior and the timing of the incident?
Why SQL Server bottleneck categories are only a starting point
CPU, I/O, blocking and network are helpful categories because they describe where pressure becomes visible. They become risky when they are used as final explanations. A SQL Server bottleneck category can guide the next question, but it should not close the investigation before the mechanism behind the symptom is understood. That is where structured SQL Server performance analysis becomes more useful than arguing over the first visible metric.
For example, “CPU bottleneck” can mean very different things in SQL Server. Sometimes the server really does not have enough processor capacity for the current workload. In other cases, the workload burns CPU unnecessarily because of poor query patterns, missing indexes, plan regressions, excessive recompilation, scalar functions, inefficient sorting, or parallelism that increases coordination overhead without reducing elapsed time. The graph may look similar, but the remediation is completely different.
An I/O bottleneck has the same problem. Storage latency matters, especially when SQL Server waits for reads or writes that should complete faster. But before blaming the storage layer, it is worth asking what created the I/O demand. A server that performs unnecessary scans, spills to tempdb, rebuilds large indexes during peak workload, or reads the same data repeatedly because memory is under pressure will naturally create storage symptoms. Replacing storage may help in some cases, but it can also hide the real workload problem for a while.
Where the bottleneck appears is not always where it begins
Network and client-side behavior are often more difficult because they sit outside the traditional comfort zone of many database investigations. A SQL Server session may show waits that appear to point away from the engine, while the real issue is slow client consumption, chatty application behavior, large result sets, inefficient middleware access patterns, or connection handling that creates unnecessary pressure. In those cases, the database server is part of the evidence, but not necessarily the place where the problem begins.
This matters in real troubleshooting work. If an application retrieves a large result set slowly, keeps transactions open while the client processes data, or performs hundreds of small roundtrips where one set-based operation would be more appropriate, SQL Server may look like the visible bottleneck while the underlying mechanism sits in the way the application consumes and drives the workload.
Good triage is not about proving that the database, storage, network or application layer is innocent. It builds a chain of evidence that explains how those layers interact under the workload that is actually failing or slowing down.
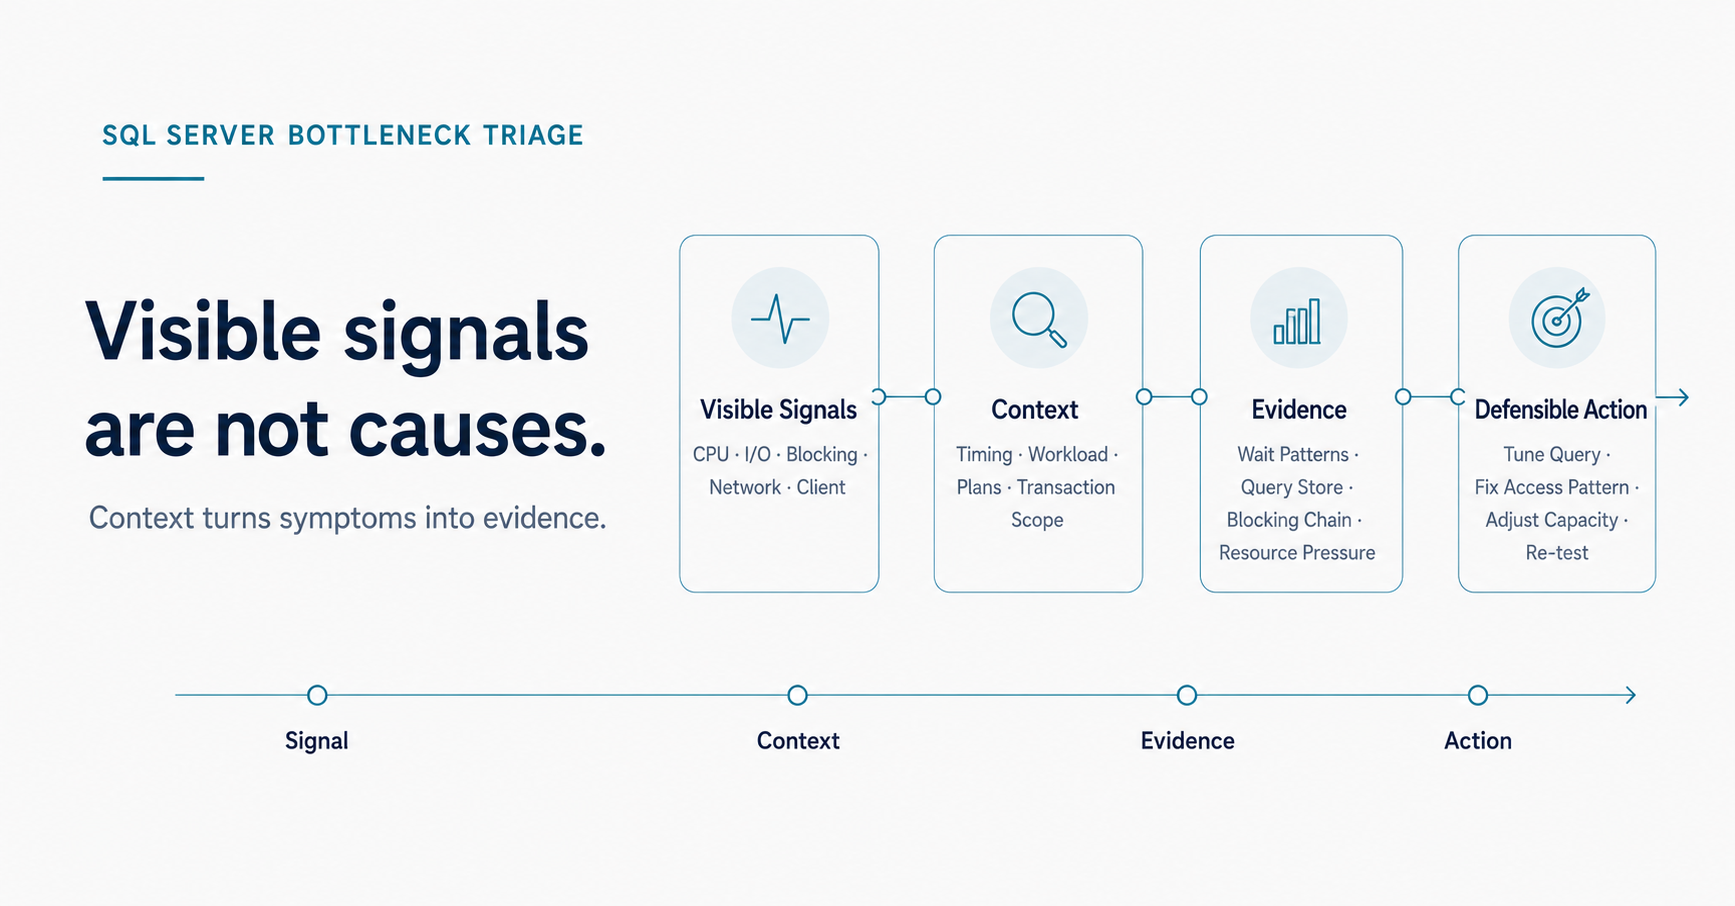
Signals need context before they become evidence
One of the most common mistakes in SQL Server performance troubleshooting is collecting signals without connecting them to context. Wait statistics, execution plans, performance counters, Query Store data, blocking chains, storage latency, memory grants and application timings can all be valuable. They become much more useful when the analysis connects them to the incident timeline. A structured SQL Server health check can help establish that broader context before individual signals are overinterpreted.
Waits and plans only become useful when they match the timeline
Wait statistics are a good example. They can show where sessions spend time waiting, but they do not automatically explain why the workload behaves that way. A dominant wait type can be a strong lead, a side effect, a normal workload characteristic, or the result of something that happened earlier. Looking at waits without workload timing, query patterns and system context can lead to confident conclusions that are still weak.
Execution plans also need context. A plan can show a scan, a join strategy, a missing index recommendation, a memory grant, a spill, or an expensive operator. None of that is automatically the cause of the incident. The same plan may be acceptable for one workload and harmful for another. The important question is whether the plan explains the observed runtime, resource consumption, concurrency impact and business timing.
In real environments, context often sits in details that do not look dramatic at first. A reporting query runs during write-heavy hours. A transaction remains open longer than expected because the application waits for user interaction. A maintenance job overlaps with a batch process. A query that was fine with yesterday’s data distribution becomes unstable after a larger import. A client retrieves a large result set slowly and keeps resources active longer than expected.
These details are not cosmetic. They are often the difference between treating the symptom and fixing the cause.
A practical triage sequence for SQL Server bottlenecks
A useful SQL Server bottleneck triage sequence starts with the visible impact, not with the metric that happens to stand out first. Which users, jobs, reports or processes are affected? When did the slowdown start? Is the issue constant, periodic, workload-specific or related to a specific batch window? Does the system recover by itself, or does it stay degraded until something is changed?
The timeline comes before the fix
From there, the investigation should build a timeline. Which workload was active when the symptoms appeared? Which queries, jobs or application processes were running at that time? Did blocking begin before CPU increased, or did CPU rise first and then create longer transaction times? Did storage latency increase because the storage layer slowed down, or because SQL Server suddenly produced more read or write pressure?
Only after that does it make sense to compare the main signals. Active requests, wait patterns, blocking chains, expensive queries, Query Store runtime data, execution plans, I/O latency, memory pressure, tempdb behavior and client waits all have a role. The point is not to review them as separate dashboard tiles. The analysis has to map them to the same incident timeline and to the workload that was active at the time.
Mechanism comes before remediation
The next step is to connect the signal to a plausible mechanism. High CPU needs a clear owner: which queries consume it, and does their behavior explain the timing of the issue? For I/O latency, the investigation has to identify the files, databases and operations involved, and what created the read or write pressure. With blocking, the relevant questions are different: which session owns the blocking chain, what transaction scope is involved, and why is the lock held for that long? When the database server looks calm while users still wait, the investigation has to follow where time is spent outside the engine.
Only then does remediation become defensible. A team may add indexes, change queries, adjust MAXDOP or cost threshold, move maintenance windows, tune storage, change isolation behavior, fix application access patterns or increase capacity. All of these responses can be valid. They are not interchangeable. The right action depends on the mechanism behind the signal, not on the category label attached to it.
Why early bottleneck conclusions are expensive
The cost of a wrong SQL Server bottleneck conclusion rarely stops at one incorrect ticket comment. A team may tune the wrong queries, scale infrastructure that does not need more capacity, blame storage without proving the workload demand, or change database settings that only move the symptom somewhere else. In mature environments, the cost can be more subtle: trust in monitoring decreases because the previous conclusion did not match reality.
This is especially relevant when different teams own different parts of the system. Database, infrastructure, storage, network and application teams often see different parts of the same incident. Without a structured triage model, each team may defend its own layer rather than combine evidence. That reaction is understandable under pressure, but it rarely helps the business problem. SQL Server performance troubleshooting works better when the discussion moves from blame to evidence.
A good triage process does not remove the complexity of a production system. It makes the next step less speculative. That matters in production environments, where every change has risk and where a quick fix can easily become the next hidden cause.
Better SQL Server bottleneck analysis starts with better questions
For me, SQL Server bottleneck triage is less about memorizing a fixed checklist and more about using a disciplined way of thinking. It starts with the user impact and a timeline, then moves through the strongest signals, the active workload and the mechanism that could plausibly connect both. The first explanation should be challenged before a change is made, especially when that change affects a productive system.
This approach helps avoid one of the common traps in performance work: optimizing what is easy to see instead of what actually limits the workload. A high number in a dashboard is useful when it points to the next question. It is dangerous when it becomes the answer too early.
The same applies to wait statistics, execution plans, monitoring tools and performance counters. They are all valuable, but none of them replaces technical judgement. They become useful when the analysis connects them with the workload, the application, the infrastructure, the maintenance model and the operational history of the system.
That is also where experience matters. Not because experience replaces data, but because it helps ask better questions before changing a productive system. In many SQL Server environments, the most important finding is not hidden behind an exotic wait type or a rare engine behavior. It is often found in the connection between several ordinary details that nobody looked at together.
From SQL Server signals to defensible action
A visible SQL Server bottleneck is a signal, not automatically a cause. CPU, I/O, blocking, network and client behavior are useful categories because they help structure the investigation, but they do not replace analysis. The important work starts when those signals are connected to workload timing, execution behavior, transaction scope, system configuration and business impact.
Good SQL Server bottleneck triage does not try to make complex systems look simple. It tries to make the next decision defensible. In production environments, that usually matters more than the fastest label: a clear path from symptom to evidence to an action that still makes sense after the pressure of the incident has passed.

Comments are closed.