
Most companies no longer have a simple visibility problem.
Visibility is only the first step
At least not in the way they might have had ten or fifteen years ago, when teams often ran critical systems with very little historical data, few useful alerts and limited insight into what had actually happened during an incident. Today, many teams monitor their SQL Server environments in some form. They use dashboards, thresholds, reports, email notifications and, in some organizations, automated incident processes that create tickets as soon as a metric crosses a defined limit.
That is a good thing. For production SQL Server systems that support important business processes, monitoring is not optional. Without it, teams often notice problems too late, lose the timeline of an incident and discuss performance issues based on assumptions rather than evidence.
The limitation is somewhere else.
SQL Server Monitoring can show that something is happening. It does not automatically explain what that signal means, why it occurred, how serious it is, or what the next reasonable action should be. That distinction may sound small, but in day-to-day operations it often separates a focused investigation from a long discussion between database, infrastructure and application teams.
The risk usually does not come from the alert itself. The risk starts when a correct signal leads to the wrong interpretation and, from there, to the wrong decision.
A CPU alert may quickly start a discussion about adding more virtual CPUs. Network waits may involve the network team. Storage waits may trigger a storage investigation. A slow application process may look like a database problem before anyone has looked closely at the workload behind it. In some cases, the first assumption is right. In many cases, it is only a hypothesis.
When a team treats a hypothesis as a diagnosis too early, it can spend a lot of time working in the wrong area.
Monitoring provides visibility, but not decision certainty
Monitoring is essential because it gives operations teams a timeline, a baseline and a way to see whether a problem is new, recurring or connected to specific jobs, reports, imports, releases or business workload. In that sense, monitoring reduces guesswork. It also helps teams discuss incidents with at least some shared data.
What it does not provide on its own is decision certainty.
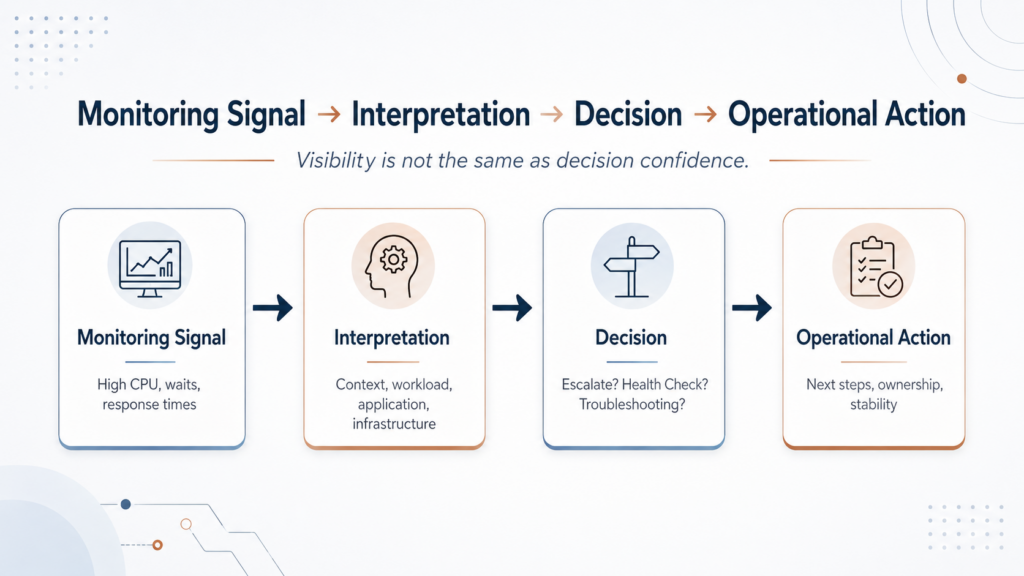
A dashboard may show high CPU, unusual waits, increased latency or longer response times. Someone still has to interpret whether this is a capacity issue, a query regression, an application pattern, a reporting workload, missing filtering, changed data distribution or simply an expected peak in business activity. The same applies to storage waits, network waits or long-running jobs. The signal is valuable, but it does not carry the full operational context with it.
This is where SQL Server Monitoring becomes more than a technical tool topic. It becomes a question of operational judgement.
If a monitoring alert appears, the organization still needs to answer several questions. Is this an incident or a known pattern? Does it require immediate escalation? Or should the team first correlate it with workload and change history? Does the infrastructure team need to be involved, or is this more likely a database or application issue? Is the right next step a SQL Server Health Check, targeted troubleshooting or a deeper SQL Server Performance Analysis?
These questions are not academic. They influence incident duration, cost, team coordination and investment decisions.
The problem is often not missing monitoring
In many SQL Server environments, the problem is not that no data exists. The data is often there. Dashboards exist, teams configure alerts and incidents are visible.
The harder part is deciding what the data actually means.
A team may interpret a CPU alert as a hardware problem, although the real issue could be a single query doing much more work after a plan change. The same team may treat network waits as a network issue, although a report may simply return a very large result set to a client. Storage waits may start a storage discussion, although the underlying problem may be a query that reads far more data than necessary.
None of these first assumptions are unreasonable. They are plausible, and sometimes they are correct. Teams need assumptions during troubleshooting. The risk starts when someone uses an assumption as the basis for a decision before testing it.
For IT leaders and technical owners, this point matters. Not every problem is solved where it first becomes visible. CPU, storage, network, SQL Server, application logic and business workload are closely connected in real production environments. A symptom may appear in one layer while the cause sits somewhere else.
When that distinction is missing, teams often react in predictable ways. They add hardware although the workload is inefficient. They involve network or storage teams although the cause is closer to query design or application behavior. They change database settings without understanding the actual load, or incidents take longer because several teams work on different interpretations of the same symptom.
The problem is then not missing monitoring.
The problem is missing interpretation.
Why diagnostic capability matters for operations
When I talk about diagnostic capability, I do not mean another tool, another dashboard or a larger monitoring stack. I mean the ability to evaluate SQL Server signals in context: workload, application behavior, infrastructure, timing, operational risk and business impact.
This capability has direct operational value. It helps teams narrow down incidents faster, avoid unnecessary escalations, involve the right people earlier and make changes with more confidence. It also helps IT leaders distinguish between an acute incident, a recurring operational weakness and a structural issue that belongs in a health check, modernization effort or architectural review.
For business-critical SQL Server environments, this is not just a technical nice-to-have. It is part of stable operations.
A monitoring system can tell you that something is unusual. It cannot replace the judgement required to decide what that signal means for the business process behind it. That judgement matters even more when SQL Server is only one component in a larger system. Application behavior, infrastructure, batch windows, reporting workloads and business deadlines all influence what “normal” looks like.
A simple example: high CPU does not always mean more CPU
A SQL Server CPU alert is a good example because it is easy to understand and very common in operations.
The dashboard turns red, the server is under pressure and the first discussion is often whether the virtual machine needs more resources. That may be the correct conclusion, especially if the workload has grown over time and the system is genuinely undersized.
But it is not the only possible explanation.
The same CPU pressure can appear in several ways. One query may start doing much more work after a plan change. A report may process more rows than before. An application pattern may change after a release. Or SQL Server may spend resources on work that better filtering, indexing or query design could have avoided.
In that situation, adding CPU may reduce the symptom for a while. It does not answer the more important operational question: why did the workload become more expensive in the first place?
This is not only a technical distinction. It affects cost, incident duration and trust in the operations process. If every CPU alert turns into a hardware discussion, the organization may invest in capacity while the actual problem remains in the workload.
The same pattern can appear with network waits, storage waits or long-running jobs. A symptom may appear in one layer while the cause sits somewhere else. That is why SQL Server Performance Analysis should not stop at the dashboard.
Monitoring, health checks and troubleshooting answer different questions
One reason for unclear expectations is that teams sometimes treat monitoring, health checks and troubleshooting as if they were the same activity.
They are related, but they answer different questions.
Monitoring observes an environment continuously and provides signals, trends and alerts. A SQL Server Health Check evaluates the condition of an environment at a specific point in time or against defined operational criteria. Troubleshooting investigates a specific problem in a specific time window with a specific impact.
A health check may show missing maintenance jobs, untested backup and restore processes, risky configuration choices or inconsistent operational standards. It can identify structural weaknesses before they become incidents. It can also help an organization understand where operational risk exists.
But a health check does not automatically explain why a specific application was slow yesterday between 10:15 and 10:45.
Monitoring may show that CPU, waits or duration looked unusual in that window. Still, that is not a full root cause analysis. Troubleshooting has to connect the signal to the affected workload, query, plan, application behavior, change history and data volume.
When teams separate these concepts clearly, expectations become more realistic and actions become easier to plan. The team knows whether it is looking for structural risk, a specific root cause, or an operational pattern that it needs to watch over time.
More monitoring is not always the answer
When teams are uncertain, it is tempting to add more monitoring.
More metrics, more dashboards, more thresholds and more alerts can help when important information is missing. However, if teams already have the data but do not interpret it correctly, more signals only increase the amount of information they need to review, explain and prioritize.
The result can be an environment where everything is measured, but the important question remains unanswered: what do we do with this information?
For SQL Server operations, the discussion should therefore not stop at tools and dashboards. It should include ownership, escalation paths, diagnostic skills, decision authority and the ability to translate technical findings into operational action.
This is often the difference between monitoring as a data source and monitoring as part of a reliable operating model.
Microsoft also describes SQL Server monitoring as a way to assess performance, track trends and choose the right tools for the type of monitoring involved. That technical perspective is useful, but it still requires operational interpretation before teams can turn data into decisions. Microsoft Learn: SQL Server performance monitoring and tuning tools.
When external support can be useful
Not every SQL Server performance issue requires external help. In many environments, the internal team can investigate problems when it has the time, the required access and a clear process for analysis.
External support becomes useful when the same problems keep returning. It also helps when alerts are visible but the cause remains unclear, when teams hand symptoms back and forth, or when SQL Server, application logic, infrastructure and business process are too closely connected to isolate the issue quickly.
It can also be useful when an organization needs a neutral assessment before decisions about hardware, migration, modernization, architecture or operational standards. In these situations, the goal is not to replace the internal operations team. The value is independent technical interpretation: which signals matter, which hypotheses are plausible, which risks should be prioritized and which actions are reasonable.
This is where CraftedSQL can be useful: not by adding another dashboard, but by helping turn SQL Server signals into clearer technical assessment and practical next steps.
Connection to the technical deep dive on SQL-aus-Hamburg
The technical side of this topic belongs on SQL-aus-Hamburg.
There, the focus is on the SQL Server analysis path itself: active requests, wait stats, Query Store, network waits and the way a monitoring signal becomes a testable hypothesis.
This CraftedSQL article intentionally looks at the other side. It is not about the individual T-SQL query. It is about the operational question behind it: how does monitoring become a reliable decision?
Both perspectives belong together, but they should not be mixed. The technical deep dive helps with the concrete SQL Server analysis. The business and operations perspective helps with prioritization, communication, risk assessment and decision-making.
Conclusion
SQL Server Monitoring is important, but monitoring alone does not create a stable SQL Server environment.
Stability begins when teams interpret signals correctly, test hypotheses and base actions on evidence rather than assumptions. An alert is a starting point, not a decision.
For companies running important SQL Server workloads, the question is therefore not only whether monitoring exists. The more important question is how teams interpret monitoring data, who turns technical signals into operational decisions and how the organization prioritizes risks.
That is less visible than a new dashboard, but in day-to-day operations it is often much more valuable.
If SQL Server Monitoring regularly shows anomalies but the cause remains unclear, a structured SQL Server Performance Analysis or a focused SQL Server Health Check can help. It can turn signals into a clearer assessment and practical next steps.
