
I have seen many SQL Server bottlenecks investigated through the metric that looked loudest, not through the question that mattered most. CPU is high, storage latency looks suspicious, blocking appears in monitoring, or users report that the application feels slow. At that moment, it is tempting to follow the most visible signal immediately. Sometimes that signal does point in the right direction, but quite often it is only the most measurable part of a wider problem.
This is exactly where bottleneck triage earns its place in a SQL Server investigation. The first visible bottleneck deserves attention, but it should not define the conclusion too early. A server can show high CPU because queries became more expensive, because concurrency increased, because parallelism changed the workload shape, or because behavior outside the database changed the way SQL Server receives, waits for, or processes work. The same kind of misdirection can happen with I/O, blocking, network waits, and client-side behavior. Categories help to structure the investigation, but they are not the investigation by themselves.
SQL Server bottlenecks are signals, not conclusions
When SQL Server slows down, it is reasonable to start with familiar categories. CPU, memory, storage, blocking, network, and client behavior provide a useful first structure. They reduce noise and give the investigation a place to begin. Without that structure, troubleshooting can quickly turn into random checking: one query plan here, one wait statistic there, a storage graph somewhere else.
The mistake starts when these categories become conclusions too early. High CPU does not automatically make the CPU subsystem the root cause, and slow I/O does not prove that storage is broken. Blocking may point to the session at the head of the chain, but that session is not always the real problem. A client timeout adds another layer of ambiguity, because SQL Server and the application do not always experience “slow” in the same way. In practice, a visible bottleneck may be the cause, the consequence, the amplifier, or simply the layer where the problem becomes easiest to measure.
This distinction is closely related to the difference between visible SQL Server performance symptoms and the underlying root causes that may sit behind them.
I use the word triage deliberately here. Triage is not about finding the final answer in the first few minutes. It is about separating signals from assumptions, identifying the most likely layer, and avoiding expensive work in the wrong direction. In SQL Server environments, that difference matters especially when several teams are involved and the pressure is already high.
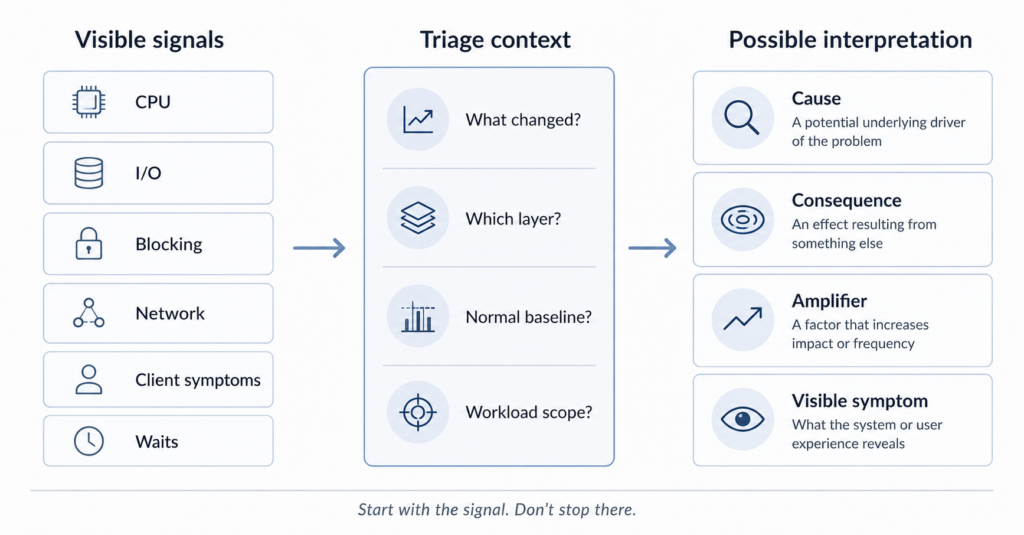
CPU, I/O, blocking and network rarely exist in isolation
CPU pressure is a good example. A system may show sustained high CPU because a query uses an inefficient plan, because statistics no longer describe the data well, because parameter sensitivity changes the execution path, or because a workload that used to run in a quiet window now overlaps with interactive usage. The processor is busy, but that does not automatically make CPU the root cause. It may only be the place where workload, plan choice, concurrency, and timing become visible at the same time.
I/O symptoms can be just as misleading, although they often feel easier to discuss because latency numbers look concrete. Read or write latency can point to storage pressure, but it can also reflect query patterns that read too much data, missing or unsuitable indexes, tempdb activity, maintenance jobs, backup timing, virtualization behavior, or a workload change that increased physical reads. If the investigation stops at the storage graph, the team may spend time in the infrastructure layer while the real issue sits higher in the stack.
Blocking needs more than the head of the chain
Blocking creates a different kind of trap. It is easy to focus on the session that appears at the head of a blocking chain, and sometimes that is exactly where the investigation should start. But blocking is often the visible result of transaction design, isolation level choices, long-running application workflows, missing indexes, batch processes, reporting queries, or changed execution plans. Killing a session may relieve pressure for a moment. It rarely explains why that blocking pattern appeared, or why it became painful now.
Client symptoms need server-side context
Network and client-side symptoms add another layer of ambiguity. From the user perspective, the database is slow. The application may only report that a command timed out. SQL Server may have completed the query, waited on the client, or spent time in a pattern that only becomes clear when server-side metrics and application behavior are reviewed together. People often blame the database first because they can measure it more easily. That does not make it the only place where the problem can originate.
The wrong layer can waste more time than the original problem
A practical SQL Server bottleneck triage should not begin with the question, “Which tool should I open first?” It should begin with a more uncomfortable question: “What exactly changed, and where is the evidence?” That sounds simple, but in production troubleshooting it is often the step teams skip when everyone wants an answer quickly.
Before going deep into query tuning, storage analysis, or infrastructure discussions, it is worth establishing the shape of the problem. Is the issue global or limited to one workload? Did it start suddenly, or did it build up over time? Does it affect all users, one application path, a specific job, or a reporting workload? The timing also matters: a deployment, maintenance job, statistics update, index change, configuration change, failover, virtualization event, storage change, or business process may explain why the issue appeared when it did.
Only after that context is clear do the technical indicators become more useful. Wait statistics can show where SQL Server spent time, but they need workload context. Execution plans can explain how a query was executed, but they need parameter, data distribution, and timing context. CPU and I/O metrics can show pressure, but the team needs to compare them with normal baseline behavior. Blocking information can show who waited on whom, but transaction and application context decide whether that information supports a useful conclusion.
The goal is not to slow the technical work down. The goal is to prevent the investigation from becoming a collection of unrelated screenshots, scripts, and opinions. Good triage narrows the problem space and keeps the team from spending hours proving something that was visible, measurable, and still not the real cause.
Small operational details often decide the direction
In many environments, the decisive information is not hidden in an exotic metric. It is often in the operational details that were not treated as important enough when they changed. Someone moved a job schedule, a report now runs during business hours, or a deployment altered transaction scope. The application may retry more aggressively than before. Maintenance can overlap with a workload peak. A blocking pattern may have existed for months, but only became visible after data volume increased.
These are the details that rarely look important in an architecture diagram, but often decide where an investigation should go next. SQL Server performance problems do not respect the boundaries between database, infrastructure, application, and operations. A good investigation therefore has to move between layers without losing discipline. It should be technical enough to interpret waits, plans, memory, CPU, I/O, locking, and client behavior, but operational enough to understand timing, ownership, history, and change.
Dashboards sit right in the middle of this problem. A good dashboard can shorten the time to the first useful signal. A poor interpretation of a good dashboard can send the team into the wrong layer with confidence. The metric may be correct, while the conclusion is still wrong.
How to approach SQL Server bottlenecks
A defensible troubleshooting approach treats SQL Server bottlenecks as starting points, not as verdicts. CPU pressure should lead to questions about workload, plans, parallelism, compilation, concurrency, and timing. I/O pressure should lead to questions about data access patterns, memory, tempdb, storage behavior, maintenance, and changes in volume. Blocking should lead to questions about transaction scope, isolation, indexing, application behavior, and workload overlap.
The practical sequence is usually straightforward, even when the environment is not. First, define the symptom as precisely as possible. Then establish timing and scope. Compare the current behavior with a known baseline, for example from workload history or Query Store data, if one exists. Identify the dominant technical signals, but do not treat them as final proof. Check whether recent changes explain the timing. Only then decide whether the next step belongs in query tuning, indexing, configuration, infrastructure, application behavior, or operational scheduling.
This approach may feel slower than jumping to a familiar script in the first minute. In many incidents, it is faster over the whole investigation because it reduces rework, avoids false certainty, and helps the team spend time in the layer where the evidence actually points.
Troubleshooting is a technical skill, but also an operational discipline
SQL Server bottleneck triage is not about ignoring CPU, I/O, blocking, network, or client-side symptoms. These categories are useful and necessary. The mistake is treating them as isolated answers instead of connected signals.
In production environments, the real value comes from knowing how to interpret those signals in sequence. What is visible? What changed? Which layer is actually under pressure? Which layer only shows the pain? Did SQL Server cause the problem, amplify it, or merely expose it because that is where the waiting becomes measurable?
SQL Server bottlenecks deserve attention, but they should not close the investigation too early. In production, that distinction is not theoretical; it is the difference between reacting to the loudest signal and building a defensible investigation. Good troubleshooting keeps the question open long enough for the evidence to become useful.
